Frasers Property Limited (FPL) recently released a business update for 1Q24, following their full-year results for FY23 (period ended 30 September 2023). In this article, we provide a credit update on FPL based on its latest reported results (FY23 and 1Q24). We also encourage investors to read our previous coverage on this issuer based on 1H23 and 3Q23 data.
FPL’s performance in recent quarters remained resilient despite higher interest rates and uncertain macro conditions. FPL continues to be a solid issuer with a low probability of default, and we think their bonds can serve as stable building blocks for an investor’s fixed income portfolio.
FPL earnings highlights
(Note: Dollar amounts in SGD, growth rates are YoY, all as of FY23 unless otherwise stated.)
FPL’s revenues grew by a modest +$70m to $3,947m, while PBIT (profit before interest, fair value change, tax, and exceptional items) also grew by +$64m (+5%) to $1,313m in FY23. The Hospitality segment delivered a robust +20% revenue growth and +28% PBIT growth in that period (Charts 1 and 2). We provide a quick performance overview of FPL’s five core segments in the table below (Table 1).
Despite modest positive growth for FPL’s revenue and PBIT, the issuer suffered a significant decline in net income. The largest headwind was from unrealised net fair value losses of -$446m in FY23 (FY22: net gains of +$1,076m), primarily due to higher cap-rates amidst a rising-rates environment. Net interest expense also increased by +30% to $429m (FY22: $330m), with the average cost of debt rising within the broader rising-rates environment (FY22: 2.7% / FY23: 3.5%), as well as the higher net debt position of the company over the past fiscal year (FY22: $12.6b / FY23: $13.8b). Taking these factors together, FPL reported a net profit of $295m in FY23, marking an -83% decline from FY22’s figure of $1,771m.
We think FPL’s revenues and PBIT paint a picture of operational resilience for the issuer, notwithstanding the significant changes in the fair value of its properties. With major central banks (e.g. Fed) gradually slowing their pace of rate hikes and even signalling potential rate cuts later in 2024, we expect any deterioration in the net fair values of properties and increases in net interest expense to be less marked in FY24 compared to what we have already observed in FY23.
Chart 1: FPL Revenue ($m)
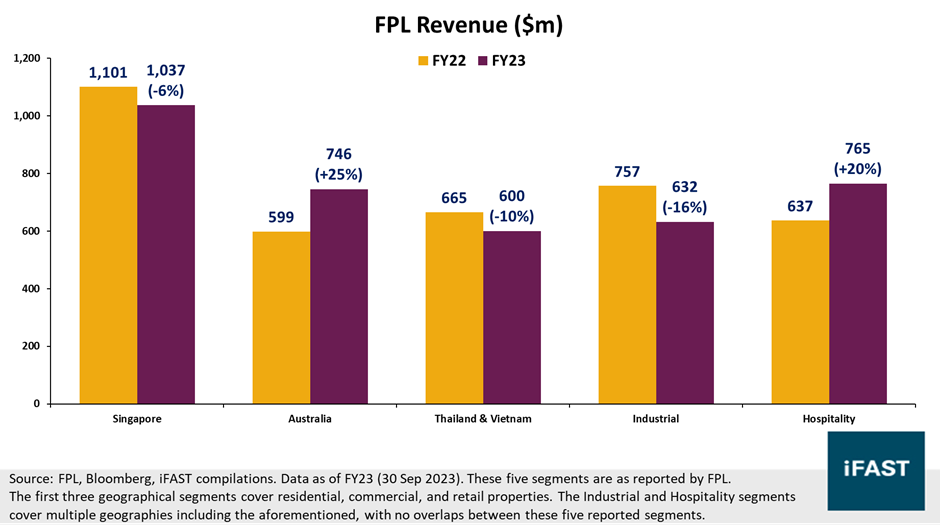
Chart 2: FPL PBIT ($m)
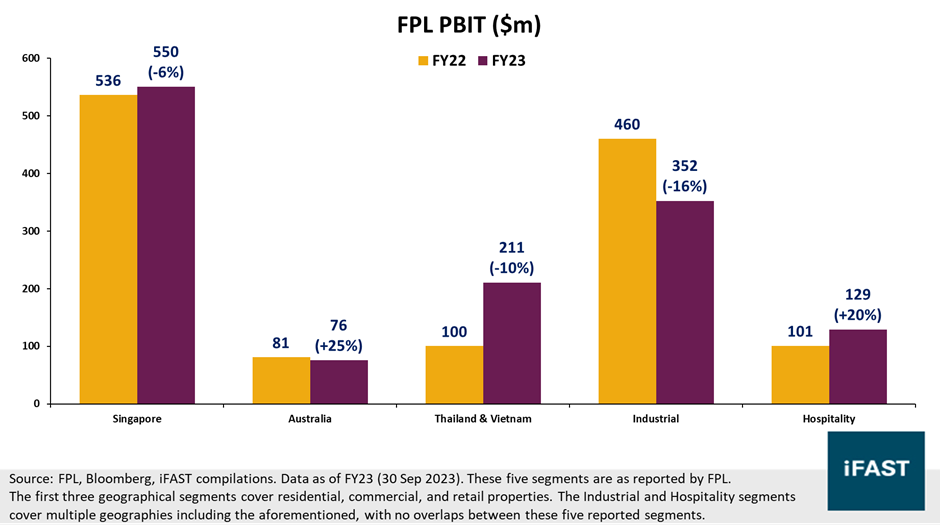
Table 1: Performance overview for FPL in FY23 and 1Q24
| Segment Highlights | FY23 Performance Summary | 1Q24 Business Update (Not reflected in FY23 Financials) |
| Singapore | • Revenues were weighed down (-6%) by lower
contributions from Rivière which received its TOP in January 2023. • PBIT was more resilient (+3%), supported by higher margins from Rivière
and positive effects from the NEX acquisition (completed in 2Q23). |
• Residential business remained
resilient • Retail portfolio retained high occupancy levels • Commercial operational performance remained stable with positive rental
reversion in 1Q24 |
| Australia | • While revenues saw a decent +25% growth, PBIT saw a moderate decline (-7%) due to lower occupancies across commercial assets. | • Robust
housing demand, stable occupancy and income in retail • Commercial portfolio likely seeing headwinds (occupancy dipped below 50%) |
| Industrial | • Both revenue and PBIT saw sizeable declines of
-16% and -23% respectively. • Non-REIT segment suffered fair value losses from investment properties
held through a joint venture, despite stable operating PBIT. |
• Pipeline and leasing conditions remain
strong • High occupancy rates (100% in Australia, 96.7% in the EU) |
| Hospitality | • Strong revenue and PBIT growth rates were driven by higher occupancies and room rates (in local currencies) across its two main geographical sub-segments (Asia Pacific / Europe & UK). | • Weaker
performance in Singapore as the market normalised, following the end of
government quarantine contracts and increased room supply • EMEA occupancy/RevPAR improved with stronger demand |
| Thailand & Vietnam | • Strong PBIT growth of +110% despite a -10%
decline in revenues. • Primarily driven by net fair value gains from investment properties held
through joint ventures and associates in Thailand. |
• Headwinds in the Thai residential
property business amidst higher costs and interest rates • Decent momentum in Thai and Vietnam Industrial & Logistics |
| Source: FPL, Bloomberg, iFAST compilations. Data as of FY23 (30 Sep 2023) and 1Q24 (31 Dec 2023). These five segments are as reported by FPL. The first three geographical segments cover residential, commercial, and retail properties. The Industrial and Hospitality segments cover multiple geographies including the aforementioned, with no overlaps between these five reported segments. | ||
Outlook
Management has guided that macro headwinds and higher-for-longer interest rates are two trends likely to persist in FY24, while also cautioning on ‘shocks from prevailing geopolitical tensions’. Nonetheless, their tone appears to be one of cautious optimism, as they have highlighted ‘opportunities from structural shifts’ as well while proactively managing said risks.
We broadly agree with this sentiment – despite the multiple uncertainties ahead, FPL continues to be a solid issuer poised to remain resilient amidst headwinds. An anchor for FPL is its strong asset quality observed through its broadly high and stable occupancy rates. We also reiterate our view from our previous article that some segments are poised to benefit from tailwinds – examples include (i) Industrial & Logistics from its healthy pipeline and onshoring trends for regions like Vietnam and (ii) Hospitality from the ongoing tourism recovery with international tourist arrivals expected to reach pre-pandemic levels in 2024.
FPL credit highlights
In general, FPL’s financial ratios have deteriorated over the past fiscal year (from FY22 to FY23) (points below and Table 2), but do not think there are many major red flags. The company possesses decent operating performance and its cash outflows were largely directed towards investing activities that could potentially drive longer-term profitability. We highlight two points below:
- FPL’s operating cashflow ratio improved to 23.5% in FY23 on the back of stronger operating cashflow – this was expected given the decent operating performance highlighted in the previous section.
- FPL’s cash position declined to $2,659m in FY23 while its cash ratio also worsened to 40.1%. One main driver was significant net cash outflows from investing activities (FY23: -$1,468m outflow / FY22: $49m inflow) due to investment/loans to joint ventures/associates and development expenditure on investment properties.
We also do not see any signs of a longer-term structural decline in FPL’s longer-term credit profile. While its net-debt-to-total-equity and net-debt-to-property-assets ratios both worsened from FY22 to FY23 (with signs of slight worsening in 1Q24 too), alongside a lower net interest coverage ratio in FY23, we think these were primarily driven by more one-off events like the recent NEX acquisition and redemption of perpetuals.
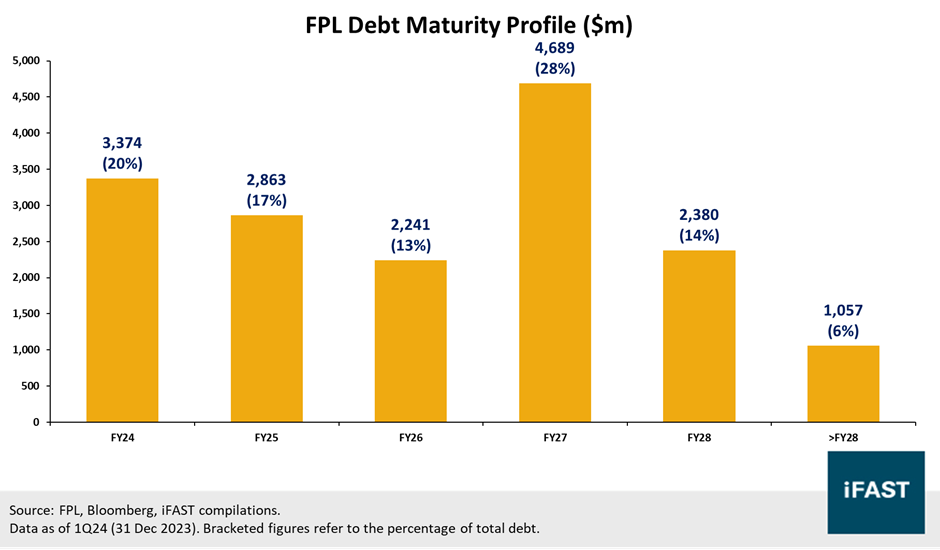
Based on FPL’s latest 1Q24 update, its overall debt profile looks manageable, helped by its well-distributed maturities, with its largest maturity wall coming in FY27 (Sep 2027) (Chart 3). Management has also expressed confidence in repaying and/or refinancing all of its debt due in FY24. Its cost of debt has increased by a sizeable margin recently (FY22: 2.7% / FY23: 3.5%) amidst an environment of higher interest rates, but this could be mitigated by the fact that 72.4% of its debt is on fixed rates as of FY23.
To summarise, we acknowledge the deterioration of FPL’s credit profile in FY23 but think that its debt levels remain manageable with a fairly low probability of default.
Table 2: FPL credit metrics
| FPL's Credit Metrics | FY22 | FY23 | 1Q24 (where available) |
| Operating Cashflow [A] | $1,184m | $1,556m | - |
| Current Liabilities [B] | $6,260m | $6,635m | - |
| Operating Cashflow Ratio [A / B] | 18.9% | 23.5% | - |
| Current Assets [C] | $8,617m | $7,672m | - |
| Current Ratio [C / B] | 1.38 | 1.16 | - |
| Cash & CE [D] | $3,322m | $2,659m | $2,464m* |
| Cash Ratio [D / B] | 53.1% | 40.1% | - |
| Net Debt [E] | $12,567m | $13,802m | $14,140m |
| Total Equity [F] | $19,379m | $18,200m | $18,128m* |
| Net Debt / Total Equity [E / F] | 64.8% | 75.8% | 78.0% |
| Property Assets [G] | $33,477m | $34,147m | $34,742m* |
| Net Debt / Property Assets [E / G] | 37.5% | 40.4% | 40.7% |
| PBIT [H] | $1,249m | $1,313m | - |
| Net Interest Expense [I] | $330m | $429m | - |
| Net Interest Coverage Ratio [H / I] | 3.78 | 3.06 | - |
| Source:
FPL, Bloomberg, iFAST compilations, iFAST estimates. Data as of FY23 (30 Sep 2023) and 1Q24 (31 Dec 2023). *Estimates based on available data. |
|||
Chart 3: FPL debt maturity profile
Recommendations
Frasers has several bonds currently outstanding (Table 3), including two perpetuals which we do not currently recommend.
- One perpetual is FPLSP 4.980% Perpetual Corp (SGD), which we do not recommend as it is extremely close (just a few days away) from its call and reset dates of 11 April 2024 – we note the presence of a step-up margin (100bps) here that could incentivise a call from FPL.
- Another perpetual is FPLSP 4.380% Perpetual Corp (SGD), which has about 3.8 years to its next reset (we see little incentive for FPL to call before the reset date). For this perpetual, we think that its indicative yield-to-reset of 4.96% does not adequately compensate for several risks over its non-perpetuals (see below), including non-call risks including after the reset date.
Our recommendations will instead focus on the non-perpetuals. Within FPL bonds, its bonds generally have similar yields in the 4.1% to 4.3% region – we think these are decent options for investors looking for a well-established issuer with a relatively low risk of default.
- FPLSP 4.250% 21Apr2026 Corp (SGD) would be best suited for investors who either want a higher coupon compared to the other fixed-rate non-retail bonds by FPL or for investors who want a shorter-maturity and shorter-duration bond option, offering an indicative yield of 4.09%.
- FPLSP 4.150% 23Feb2027 Corp (SGD) and FPLSP 3.000% 09Oct2028 Corp (SGD) both offer slightly higher indicative yields of over 4.2%. We think the choice between these two bonds depends on investor preferences on maturity / duration, and desired levels of income from coupon payments.
- FPLSP 4.490% 16Sep2027 Corp (SGD) – Retail offers notably lower yields of just 3.64%. We recommend them only for investors who wish to invest in smaller denominations below $250k.
Compared to other issuers, FPL bonds’ yields generally look comparable to those by GuocoLand (generally in the 4.1% to 4.4% region), with spreads also at very similar levels. FPL does have a slightly better credit quality based on some metrics (e.g. leverage and interest coverage ratios), and we advise investors with lower risk tolerances to select FPL bonds over GuocoLand bonds (and vice versa).
Table 3: List of FPL bonds (recommendations bolded)
| Bond Name | Reset / Maturity Date (Years to Reset / Maturity) |
Ask Price | Yield to Reset / Maturity (%) |
| FPLSP 4.980% Perpetual Corp (SGD) |
11 Apr 2024 / - (0.0 / -) |
100.000 | 3.64% / - |
| FPLSP 4.380% Perpetual Corp (SGD) |
17 Jan 2028 / - (3.8 / -) |
98.225 | 4.96% / - |
| FPLSP 4.250% 21Apr2026 Corp (SGD) |
21 Apr 2026 (2.0) |
100.300 | 4.09% |
| FPLSP 4.150% 23Feb2027 Corp (SGD) |
23 Feb 2027 (2.9) |
100.133 | 4.22% |
| FPLSP 4.490% 16Sep2027 Corp (SGD) - Retail |
16 Sep 2027 (3.4) |
102.717 | 3.64% |
| FPLSP 3.000% 09Oct2028 Corp (SGD) |
09 Oct 2028 (4.5) |
95.005 | 4.23% |
| GUOLSP 3.400% 10Aug2025 Corp (SGD) |
10 Aug 2025 (1.3) |
99.024 | 4.16% |
| GUOLSP 3.290% 26Oct2026 Corp (SGD) |
26 Oct 2026 (2.6) |
97.750 | 4.23% |
| GUOLSP 4.400% 27Jul2028 Corp (SGD) |
27 Jul 2028 (4.3) |
100.000 | 4.40% |
| UOLSP 2.330% 31Aug2028 Corp (SGD) |
31 Aug 2028 (4.4) |
94.461 | 3.71% |
| CAPLSP 3.080% 19Oct2027 Corp (SGD) |
19 Oct 2027 (3.5) |
98.500 | 3.54% |
| CAPLSP 3.150% 29Aug2029 Corp (SGD) |
29 Aug 2029 (5.4) |
97.875 | 3.59% |
| CAPLSP 2.900% 21Sep2032 Corp (SGD) |
21 Sep 2032 (8.5) |
94.413 | 3.67% |
| Source: Bloomberg, Bondsupermart, iFAST compilations. Data as of 4 Apr 2024. | |||
Declaration: For specific disclosure, at the time of publication of this report, IFPL (via its connected and associated entities) holds a position in FPLSP 4.980% Perpetual Corp (SGD) and GUOLSP 3.290% 26Oct2026 Corp (SGD). The analyst who produced this report holds an NIL position in the abovementioned securities.
Our podcast series, Yield Hunters, is available on Spotify, iTunes Podcasts and Google Podcasts. We share our thoughts on new bond issues and hold discussions on the fixed income space. Listen to our latest episode below and follow us!